Smart water meter leak detection does not begin with an alarm icon on a dashboard. It begins with a meter capable of measuring the relevant low flow, a data interval short enough to reveal the event, and detection rules that distinguish unexpected consumption from normal continuous use.
A residential toilet leak, an irrigation valve left open, a cooling tower, and a factory process may all produce continuous flow. However, only some of these conditions represent faults.
For utilities and property managers, the real challenge is therefore not simply detecting water movement. It is deciding:
- What flow pattern should trigger an alert
- How quickly the alert must arrive
- Which accounts normally use water continuously
- Whether the meter can measure the target leak rate
- How missing data affects the decision
- Who should receive and investigate the alarm
- Whether a remote valve should close automatically
- How detection performance will be tested before mass deployment
This guide explains how to design, procure, and validate a smart water meter leak detection system that produces useful, actionable alerts instead of an unmanageable list of false positives.
Table of Contents
What Smart Water Meter Leak Detection Actually Means
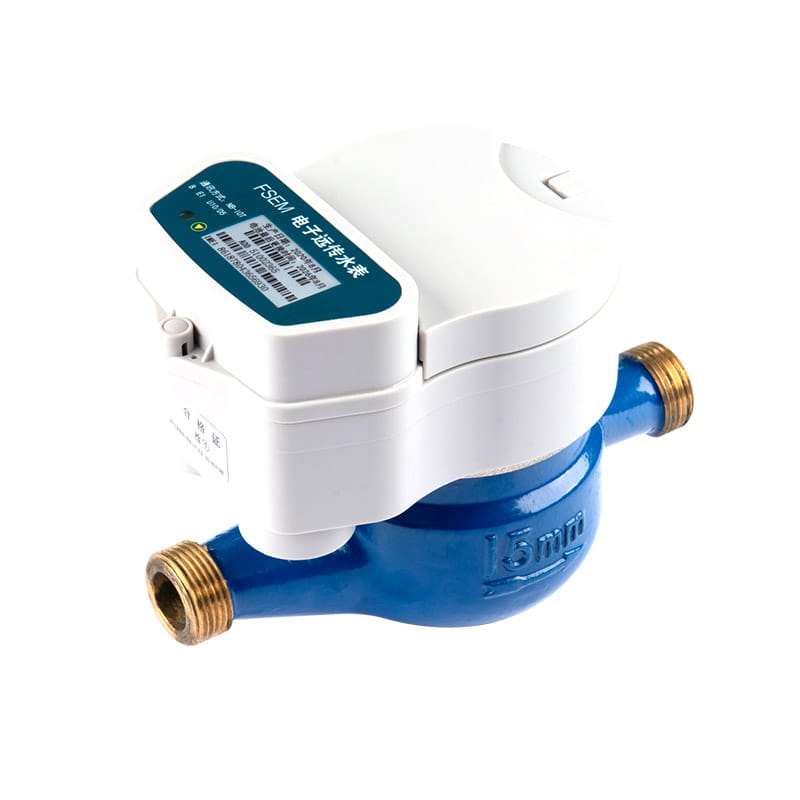
A smart meter generally does not locate the physical crack, loose fitting, faulty toilet valve, or damaged appliance. It measures water passing through the meter and identifies a pattern that may indicate leakage or abnormal consumption.
The complete detection path includes:
- The metering element measures flow.
- The meter creates timestamped readings or event records.
- A communication module uploads the data.
- The platform applies a detection rule.
- An alert is delivered to an operator or customer.
- The event is investigated and classified.
- Corrective action is taken.
- The system verifies whether flow returned to normal.
The U.S. EPA notes that advanced metering infrastructure can provide frequent water-use data that helps utilities and facility managers identify leaks earlier. However, the usefulness of that data depends on meter capability, interval resolution, network reliability, analytics, and the response workflow.
A smart meter is therefore an observation point—not a complete leak-management program by itself.
Four Types of Leak or Abnormal-Use Patterns
A detection system should recognize that water loss does not always follow the same pattern.
| Pattern | Typical Data Signature | Possible Cause | Main Detection Challenge |
|---|---|---|---|
| Continuous low flow | Small positive flow in every interval | Toilet valve, dripping fixture, small pipe leak | Must distinguish real flow from meter noise and normal continuous demand |
| Intermittent repeated flow | Similar short events recurring frequently | Cycling toilet, equipment refill, irrigation fault | A continuous-flow rule may miss it |
| Sudden high flow | Rapid increase above the normal range | Burst pipe, open hydrant, failed hose | Legitimate peak demand may appear similar |
| Gradual baseline increase | Minimum daily flow rises over days or weeks | Developing leak, worn valve, process change | Requires historical comparison and stable baseline data |
A single threshold cannot handle all four patterns reliably. Projects normally need several rules, each with its own flow threshold, persistence period, user category, and escalation process.
Continuous Flow Detection
Continuous flow is one of the simplest and most widely used approaches. The system looks for positive consumption during every interval across a defined period.
For example, an account may be flagged if measurable flow occurs in every 15-minute interval for 24 hours.
This method works well for locations that normally have periods of zero consumption. A residence, small office, school during closure, or seasonal property may fit this pattern.
It is less useful for sites where legitimate water use continues throughout the day, including:
- Hospitals
- Hotels
- Industrial plants
- Cooling towers
- Livestock facilities
- Apartment buildings
- Data centers with water-based cooling
- Sites with continuous treatment processes
These accounts need different rules or an exemption tag. Otherwise, the platform will repeatedly report expected operating flow as leakage.
Minimum Night Flow
Minimum night flow analysis examines water use during the lowest-demand period. It can reveal a persistent baseline that is hidden by normal daytime activity.
The analysis period must match the customer type. A fixed midnight-to-4:00 a.m. window may work for some residences but not for factories with night shifts, hotels, hospitals, or irrigation systems.
A stronger method compares the current minimum flow with:
- The account’s historical baseline
- Similar days of the week
- Seasonal demand
- Operating schedules
- Occupancy or production changes
- Known continuous processes
Burst and High-Flow Detection
A burst rule identifies unusually high flow or rapid consumption growth.
A basic rule might trigger when flow exceeds a fixed value for a specified number of intervals. A more advanced rule compares current flow with the customer’s historical profile.
Fixed thresholds are easy to understand but difficult to apply across mixed meter sizes and customer types. A flow rate that is extreme for a house may be normal for a hotel, production line, or apartment building.
For this reason, the RFQ should allow different high-flow thresholds for:
- Residential accounts
- Commercial buildings
- Industrial facilities
- Irrigation users
- Public buildings
- Vacant properties
- Different meter sizes
An alarm should also state whether the threshold was exceeded once, remained above the limit, or represented a statistical deviation from the normal pattern.
Intermittent Leak Detection
Not every leak produces uninterrupted flow. A faulty toilet may refill repeatedly, a pressure-dependent leak may appear only during certain periods, and a damaged irrigation valve may operate according to a schedule.
An intermittent leak rule can evaluate:
- Number of similar events per day
- Flow duration
- Repeated consumption volume
- Time between events
- Occurrence during expected zero-use periods
- Difference from the historical pattern
This analysis requires finer interval data than monthly or daily totals. If the meter only uploads one cumulative reading each day and stores no interval history, repeated short events may be invisible.
Why Data Interval Controls Leak Visibility
Smart water meter leak detection depends on the relationship between event duration and data interval.
Consider a 20-minute abnormal flow event.
| Data Interval | Likely Visibility |
| 1 minute | Shape, duration, and approximate flow rate can be analyzed |
| 5 minutes | Event remains reasonably visible |
| 15 minutes | Event may appear in one or two records |
| 1 hour | Event is blended with other consumption |
| 24 hours | Only the added daily volume is visible |
Shorter intervals provide more detail, but they also create larger data volumes and may increase meter storage, transmission, platform, and battery requirements.
The buyer should define four separate parameters:
- Measurement interval: how often flow is measured
- Storage interval: how often a timestamped record is saved
- Upload interval: how often records are transmitted
- Alarm latency: how quickly a qualifying event should be reported
These values do not have to be identical. A meter may store 15-minute readings, upload them once per day, and send an urgent alarm immediately when a burst threshold is exceeded.
For a broader explanation of this data chain, see the guide to remote meter reading system architecture.
Low-Flow Performance Determines Which Leaks Are Visible
A platform cannot reliably analyze a flow that the meter does not measure.
Before specifying a leak threshold, compare it with the meter’s:
- Q1 minimum flow
- R ratio
- Starting flow
- Resolution
- Zero-flow stability
- Approved installation orientation
- Error performance near the lower measuring boundary
Q1 and starting flow are not the same.
Q1 is the lowest flow covered by the applicable metrological accuracy limits. Starting flow is the point at which the meter begins to register movement. A meter may indicate flow below Q1 without guaranteeing the same measurement accuracy there.
Suppose a project wants to alert on 8 L/h of continuous consumption, but the offered meter has a Q1 of 15.6 L/h. The meter may sometimes register the event, but the buyer should not assume that an 8 L/h alarm will have repeatable metrological performance without supporting test data.
For the relationship among Q1, Q2, Q3, Q4 and R ratios, read the water meter accuracy classes guide.
Ultrasonic Metering and Low Flow
An ultrasonic meter has no mechanical impeller in the measuring channel. Depending on the approved model and configuration, this can support a wide measuring range and low-flow sensitivity.
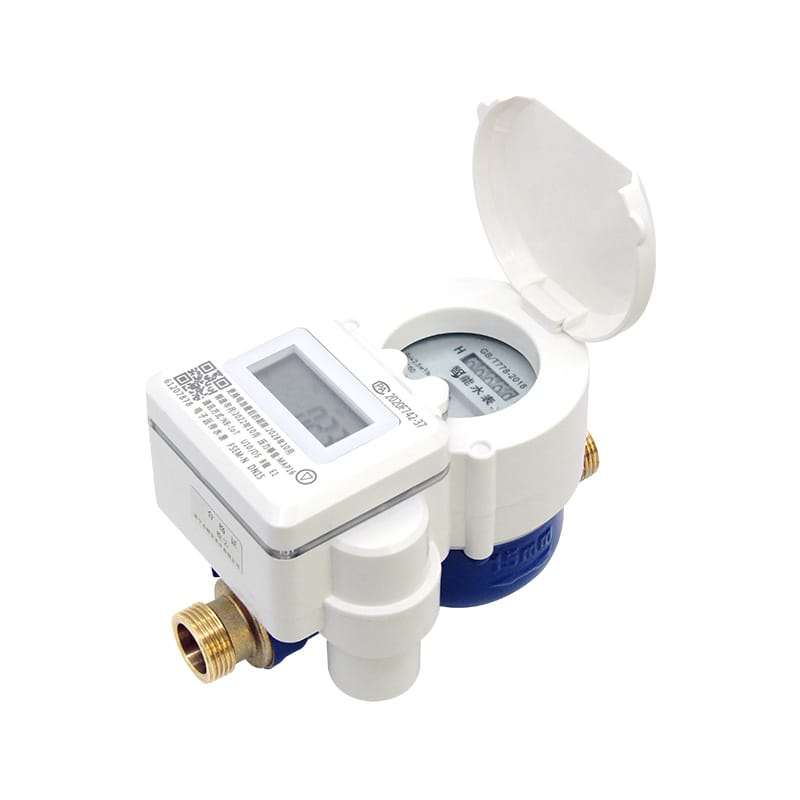
Dingjia’s residential ultrasonic water meter is available for DN15–DN40 applications. Buyers should compare the exact Q3, R ratio, Q1, installation orientation, communication configuration, and approval documents for the offered size.
Ultrasonic technology does not make every alarm automatically accurate. Pipe fullness, air, installation position, meter sizing, firmware, data resolution, and detection logic still affect the result.
Leak Volume Depends on Flow and Response Time
A small continuous flow can create a large cumulative loss when it remains unnoticed.
The calculation is:
Leak volume = flow rate × duration
| Continuous Flow | Daily Volume | 30-Day Volume |
| 2 L/h | 48 L | 1,440 L |
| 5 L/h | 120 L | 3,600 L |
| 10 L/h | 240 L | 7,200 L |
| 25 L/h | 600 L | 18,000 L |
| 50 L/h | 1,200 L | 36,000 L |
These are mathematical examples, not guaranteed detection limits for a specific meter.
The table illustrates why alarm latency matters. A system that identifies a 10 L/h event after 24 hours provides a different operational result from one that waits until the next monthly bill.
However, reducing the persistence period too aggressively can increase false alarms. A household may legitimately use water for several hours, while an industrial account may run continuously by design.
The alarm rule must balance detection speed with the normal consumption profile.
Why False Alarms Occur
False alarms reduce trust. When operators or customers receive too many irrelevant warnings, they may ignore a genuine event.
Normal Continuous Consumption
A hotel, hospital, cooling tower, livestock site, or production process may have no zero-flow period. A generic continuous-flow rule is unsuitable unless it uses an account-specific baseline.
Irrigation and Scheduled Equipment
Irrigation, water treatment, tank refill, humidification, and automatic cleaning may run during low-occupancy periods. These operations can look abnormal when the platform does not know the schedule.
Meter Noise Near Zero Flow
Small fluctuations may appear around the zero-flow boundary. The detection logic should include an appropriate minimum threshold, persistence requirement, and meter-specific behavior rather than treating every positive value as real leakage.
Estimated or Missing Data
A platform may fill missing intervals with an estimated value, repeat the last known value, or leave a gap. If estimated records are treated as measured flow, a false continuous-flow event can be created.
Every record should include a quality flag showing whether it is:
- Measured
- Estimated
- Recovered from meter memory
- Duplicated
- Corrected
- Missing
- Invalid
Timestamp Errors
Incorrect time zones, daylight-saving changes, clock drift, and delayed backfill can place consumption in the wrong interval. Leak analytics should use the measurement timestamp, not merely the server-receipt time.
Occupancy and Operating Changes
A vacant property may become occupied. A factory may add a night shift. A building may start a new cooling process.
Detection thresholds should be reviewed when the customer’s operating profile changes.
How to Build Better Leak Alert Rules
A useful alert contains more than “possible leak.”
The rule should combine several conditions.
| Rule Component | Example Question |
| Flow threshold | What minimum flow must be exceeded? |
| Persistence | How long must the condition continue? |
| Interval completeness | How much valid data is required? |
| Customer class | Is the account residential, commercial, industrial, or irrigation? |
| Schedule | Is the flow expected at this time? |
| Baseline comparison | How different is it from normal behavior? |
| Severity | Is this informational, urgent, or critical? |
| Delivery | Who receives the alert and through which channel? |
| Escalation | What happens if the event continues? |
| Clearance | When is the alert considered resolved? |
Use Multiple Severity Levels
A practical model may include:
- Advisory: unusual use requiring observation
- Warning: persistent abnormal flow requiring customer contact
- Critical: high flow, rapid increase, or possible burst requiring urgent action
Severity should account for both rate and duration. A very high flow for ten minutes may deserve more urgent attention than a small overnight baseline, even if both are abnormal.
Add a Persistence Period
Requiring several consecutive qualifying intervals reduces alerts caused by brief legitimate use.
The persistence period should be shorter for burst detection and longer for low-flow continuous-use detection.
Compare With a Baseline
Baseline-based rules can adapt to different customer types. Useful comparisons include:
- Same hour on previous days
- Same weekday over recent weeks
- Minimum nightly consumption
- Rolling average
- Seasonal profile
- Building occupancy
- Known equipment schedules
A baseline must also adapt when normal operations change. Otherwise, the system may continue comparing the site with an obsolete consumption pattern.
Allow Account-Level Configuration
A utility or property manager should be able to adjust or disable rules for legitimate continuous-flow users. The system should record who changed the rule, when it changed, and why.
Customer-Side Leaks and Utility-Side Water Loss Are Different
A customer meter can reveal abnormal water passing through that account. It does not automatically locate leakage in the distribution main before the meter.
Customer-Side Detection
Account-level interval data can help identify:
- Toilet and fixture leakage
- Internal pipe leakage
- Irrigation problems
- Abnormal appliance use
- Unexpected consumption at vacant properties
- Sudden high demand after a pipe failure
Distribution-Network Analysis
Utilities can compare water entering a district or pressure zone with the total registered consumption leaving it. This can support water-balance and minimum-night-flow analysis.
Network-level work may require:
- Bulk or district meters
- Pressure data
- Customer meter synchronization
- Consistent time intervals
- Verified meter accuracy
- Data-completeness controls
- Network topology
- Boundary-valve status
- Legitimate unbilled-use records
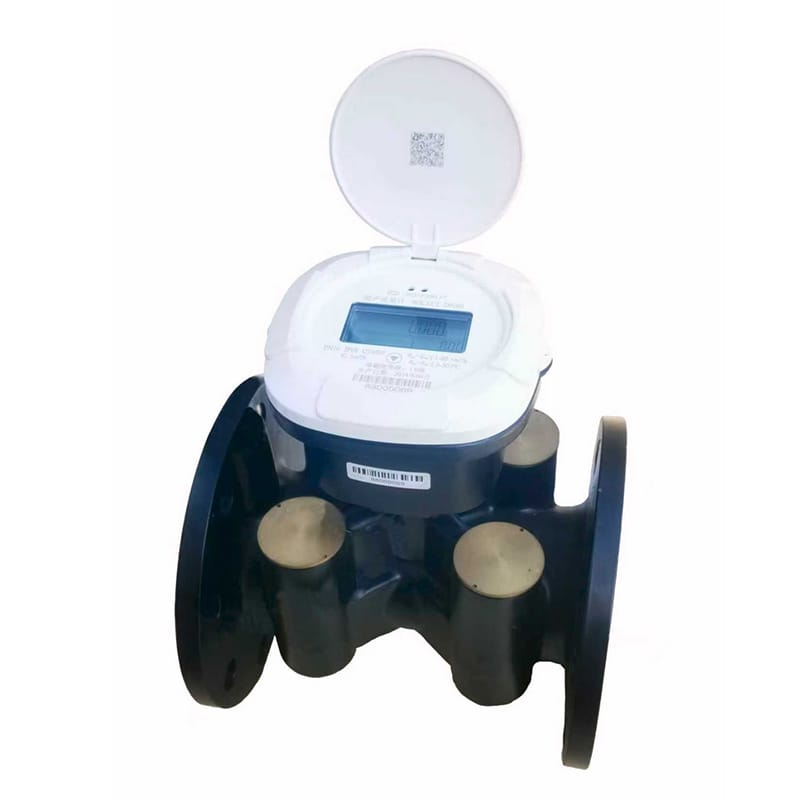
Dingjia’s pipeline network ultrasonic water meter can be considered for larger-pipe monitoring applications. Selection should be based on pipe size, flow range, pressure, installation conditions, communication, and required documentation.
A customer alert system and a distribution leak-localization program serve related but different purposes. The procurement specification should not treat them as interchangeable.
Communication Reliability Affects Alarm Reliability
An alarm cannot arrive on time if the relevant data does not reach the platform.
The system must define what happens when:
- Cellular registration fails
- A LoRaWAN gateway loses backhaul
- An M-Bus master stops polling
- A battery becomes weak
- A meter clock drifts
- Records accumulate offline
- The server rejects a payload
- Duplicate records arrive after reconnection
A temporary communication outage should not automatically erase leak evidence. The meter should retain enough timestamped data to backfill the missing period.
However, a recovered historical alarm is different from a real-time warning. The platform should identify whether the condition is:
- Active now
- Recovered from delayed data
- Already cleared
- Unconfirmed because data is incomplete
The comparison of NB-IoT, LoRaWAN and M-Bus for remote water meter reading explains how each communication architecture assigns responsibility for coverage, gateways, wiring, backhaul, and recovery.
Leak Alert, Remote Valve and Automatic Shutoff Are Not the Same
Detecting abnormal flow does not automatically justify closing a valve.
An automatic closure could interrupt:
- Fire-protection supply
- Medical operations
- Industrial processes
- Cooling systems
- Livestock watering
- Essential residential use
- A shared building supply
For this reason, projects should separate three functions:
- Leak alert: informs the user or operator.
- Remote valve command: allows an authorized person or system to request closure.
- Automatic shutoff: closes the valve without individual human approval when defined conditions are met.
Questions to Define Before Automatic Shutoff
- Which customer classes permit automatic closure?
- What flow and persistence thresholds apply?
- Is a pre-closure notification required?
- Can the customer cancel the action?
- What happens if communication is unavailable?
- How is the final valve position verified?
- Can the valve be operated manually?
- Who can reopen it?
- What happens when a valve stalls?
- Are fire and life-safety supplies excluded?
- Is there a maximum permitted closure time?
- Is every action recorded in an audit log?
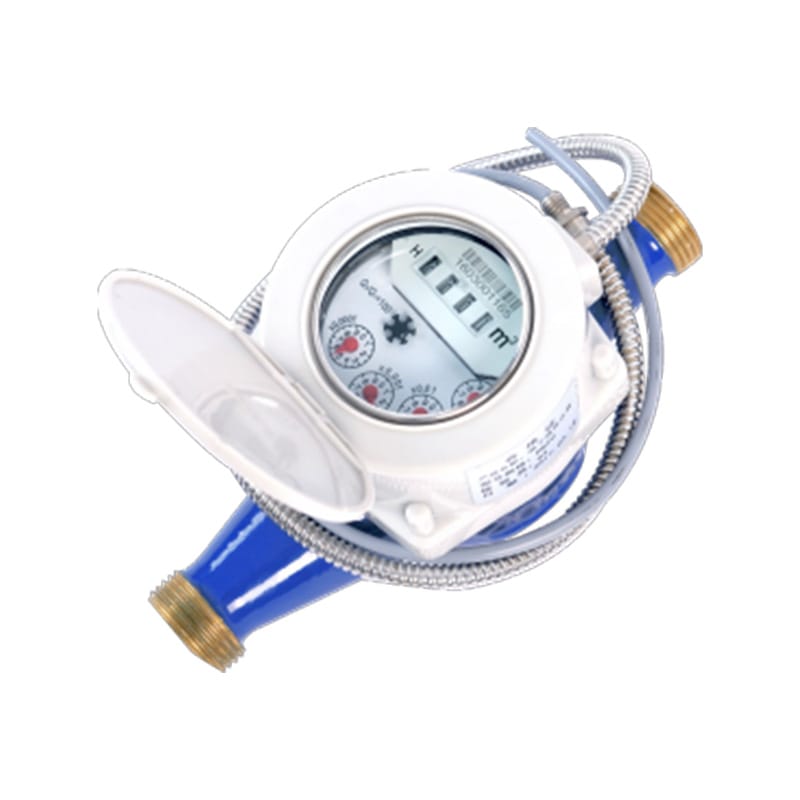
Dingjia’s remote valve-controlled water meter combines remote reading with valve management. A buyer should still test authorization, command delivery, device acknowledgement, final valve state, manual override, failure reporting, and reopening procedures.
Design the Alert Workflow Before Buying Meters
Technology can identify a suspicious pattern, but people and procedures determine whether water is actually saved.
A complete workflow should define:
- How the event is generated
- Who receives it
- How the account and location are verified
- Whether the customer is contacted
- How the site is inspected
- How the leak source is classified
- What repair or isolation action is permitted
- How the event is closed
- How avoided loss is estimated
- How the detection rule is improved
Information a Useful Alert Should Contain
- Meter and account identity
- Site address or asset location
- Detection rule
- Event start time
- Current status
- Flow rate or interval volume
- Estimated cumulative abnormal volume
- Data-completeness status
- Meter and communication health
- Historical comparison
- Contact and escalation status
- Valve status, where applicable
An alarm without context forces the operator to manually search several systems before deciding what to do.
Field Pilot for Smart Water Meter Leak Detection
A pilot should include known test events and naturally occurring consumption. It should not be limited to checking whether data appears on a dashboard.
Include Different Account Types
Select representative:
- Houses
- Apartments
- Vacant properties
- Commercial buildings
- High-consumption users
- Sites with irrigation
- Legitimate continuous-flow users
- Difficult communication locations
- Different meter sizes
- Valve-controlled accounts
Simulate Known Flow Events
Where safe and permitted, create controlled events at several flow rates and durations. Compare:
- Physical test volume
- Meter display
- Local interval record
- Platform record
- Alert creation time
- Notification time
- Final event status
The test flow must be within the approved operating conditions of the meter and installation.
Test Data Failure
Interrupt communication or backhaul, restore it, and confirm:
- Local data retention
- Correct timestamps
- Ordered backfill
- Duplicate handling
- Alert reconstruction
- Clear indication that the alert was delayed
- Recovery of current device status
Test False-Alarm Controls
Run legitimate continuous and scheduled uses to determine whether the rules incorrectly report leakage.
An effective pilot should reveal both missed events and nuisance alerts.
Recommended Pilot Metrics
| Metric | Purpose |
| Detection rate | Shows how many controlled leak events generated the expected alert |
| False-alarm rate | Shows how often normal use was incorrectly flagged |
| Detection latency | Measures time from qualifying flow to alert availability |
| Notification latency | Measures time from platform alert to recipient delivery |
| Data completeness | Confirms the required interval records are available |
| Timestamp accuracy | Supports correct event reconstruction |
| Low-flow repeatability | Evaluates performance near the intended alert threshold |
| Backfill success | Confirms records recover after communication failure |
| Duplicate rate | Identifies incorrect processing during retries |
| Alert clearance | Confirms the system recognizes when abnormal flow stops |
| Valve-command success | Verifies authorized command, execution, and returned status |
| Operator response time | Measures the real operational workflow |
| Confirmed leak ratio | Shows how many investigated alerts represent actual problems |
| Avoided volume | Estimates water saved through earlier action |
Thresholds should be set for the project rather than copied from a generic specification. A utility with daily billing operations may accept a different alert latency from a critical commercial facility.
Procurement Checklist
| RFQ Item | Information to Specify |
| Application | Residential, commercial, industrial, district, irrigation, or mixed |
| Leak types | Continuous low flow, intermittent flow, burst, baseline increase, or all |
| Meter range | DN, Q1–Q4, R ratio, starting flow, resolution, and orientation |
| Detection threshold | Minimum flow or volume required to qualify |
| Persistence | Number of consecutive intervals or duration |
| Data interval | Measurement, storage, upload, and alarm intervals |
| Data quality | Missing, estimated, invalid, corrected, and recovered flags |
| Customer classes | Rules and exemptions for each user type |
| Baseline method | Historical period, seasonal adjustment, and update logic |
| Alert severity | Advisory, warning, critical, and escalation conditions |
| Notification | Dashboard, email, SMS, API, mobile application, or another channel |
| Offline behavior | Local storage, backfill, duplicate control, and delayed-event status |
| Valve function | Manual, remote, automatic, authorization, verification, and override |
| Integration | API, billing system, GIS, work order, customer portal, and export |
| Cybersecurity | Identity, credentials, roles, audit logs, updates, and data protection |
| Reporting | Alert history, confirmed events, response time, avoided loss, and unresolved cases |
| Pilot | Account sample, controlled flows, observation period, and acceptance metrics |
| Documentation | Datasheet, approvals, alarm logic, payload, API, manuals, and test reports |
| Lifecycle | Firmware support, battery assumptions, spare devices, and technical assistance |
For a model evaluation, provide the destination country, meter size, minimum and peak flow, intended leak threshold, required data interval, communication method, installation environment, valve requirements, platform interface, quantity, and pilot plan through the Dingjia contact page.
FAQ
Can a smart water meter detect a leak automatically?
It can identify a flow pattern that matches a defined leak or abnormal-use rule. It normally cannot identify the exact physical source without further inspection. Detection performance depends on meter sensitivity, interval data, communication, analytics, thresholds, and the customer’s normal usage pattern.
What is the best data interval for water leak detection?
There is no universal best interval. Short intervals make brief and intermittent events more visible, while longer intervals reduce data and communication requirements. The selected interval should be shorter than the events the project needs to detect and should be tested against battery, storage, network, and platform capacity.
Can hourly water meter data detect leaks?
Hourly data can reveal persistent continuous use and large abnormalities, but it may hide short events by combining them with normal consumption. Applications requiring faster response or intermittent-event analysis may need 15-minute, 5-minute, or finer data.
Is starting flow the same as the smallest guaranteed leak-detection flow?
No. Starting flow indicates when the meter begins to register movement. Q1 defines the lower boundary of the standardized measuring range under the applicable accuracy limits. A project-specific alert below Q1 requires careful evaluation and supporting test evidence.
Why does my smart meter show continuous flow when there is no leak?
The site may have legitimate continuous consumption, scheduled equipment, irrigation, meter noise near zero flow, incorrect timestamps, estimated data, or a threshold that is too sensitive. The event should be investigated before being classified as leakage.
Can smart water meter leak detection find a broken distribution pipe?
A customer meter mainly observes water passing through that service connection. Distribution-pipe analysis usually requires district meters, pressure data, synchronized customer consumption, network boundaries, and water-balance methods. It is a different layer of leak management.
Should a smart meter shut off the valve automatically?
Only when the project has defined safe operating rules, exclusions, authorization, verification, manual override, and recovery procedures. Automatic closure may be unsuitable for fire protection, medical facilities, industrial processes, shared supplies, and other critical services.
Does NB-IoT improve leak-detection accuracy?
NB-IoT provides a communication path; it does not change the meter’s metrological accuracy. It can improve alarm availability when the meter, network, upload schedule, platform, and detection rules are properly configured.
How can a utility reduce false leak alarms?
Use customer-specific thresholds, persistence periods, multiple severity levels, historical baselines, operating schedules, data-quality flags, and exemptions for legitimate continuous users. Investigated events should be classified so the rules can be improved over time.
What should buyers test before a bulk order?
Test low-flow measurement, controlled leak events, normal continuous use, communication failure, offline storage, data backfill, timestamps, alert latency, false alarms, event clearance, platform integration, and valve commands where applicable.
Conclusion
Smart water meter leak detection is most effective when measurement, data, analytics, and operational response are designed as one system.
A meter must first measure the relevant flow. The data interval must preserve the event. Communication must deliver complete timestamped records. The platform must distinguish abnormal use from legitimate consumption. Finally, the utility, property manager, or customer must have a defined process for investigating and resolving the alert.